Environmental Product Declarations (EPD)
Independently certified EPDs allow direct comparison of products' life-cycle environmental impacts as shown in Table 1. The "Ratio XPS/EPS" indicates, for example, that the Ozone Depletion Potential (ODP) of EPS insulation is 41,938 times lower than a leading XPS product's and the Global Warming Potential (GWP) of EPS is 34x lower.
For 3,500 sqft with R-16 continuous insulation:
Table 1: Life-Cycle Impact Category Results for 916 Functional Units of RCPS Insulation [1,2]
| Impact Category | Units | EPS [3] | XPS [4] | Ratio XPS/EPS |
|---|---|---|---|---|
| Ozone Depletion | kg CFC-11 eq | 41,938 | ||
| Global Warming | kg CO2 eq | 2,556 | 87,316 | 34 |
| Eutrophication | kg N eq | 0.330 | 2.49 | 7.6 |
| Acidification | mol H+ eq | 421 | 914 | 2.2 |
| Total Energy | MJ | 65,418 | 81,361 | 1.24 |
| Total Solid Waste | kg | 687 | 735 | 1.07 |
| Smog Formation | kg O3 eq | 183 | 181 | 1 |
| Water Consumption | kg = liter | 9,107 | 4,993 | 0.55 |
The Functional Unit is 1 m² [10.764 ft²] of rigid cellular polystyrene (RCPS) insulation board with a thickness providing an average thermal resistance of RSI = 1 m²·K/W [R-value of 5.678 hr·ft²·°F/BTU] and with a building service life of 60 years.
Up to 164,173 kg CO2 eq in 60-year GWP reduction from the added insulation
extrapolated approximation for Canadian SFR Average[5]: 301,616 lbs over 50 years
XPS can have 84,760 kg CO2 eq Excess GWP for the added insulation[3,4] (52% of the above)
References
- Product Category Rules for Preparing an Environmental Product Declaration (EPD) for Product Group: Building Envelope Thermal Insulation, Version 1.0, 23 September 2011
- ISO 14025:2006(E), Environmental labels and declarations - Type III environmental declarations - Principles and procedures
- Environmental Product Declaration of Expanded Polystyrene (EPS) Insulation per ISO 14025, UL Environment Declaration No. 4787238561.101.1 (2017)
- Environmental Product Declaration of Extruded Polystyrene (XPS) Insulation per ISO 14025, UL Environment Declaration No. 4786548101.101.1 (2014)
- Energy and Greenhouse Gas Savings for EPS Foam Insulation Applied to Exterior Walls of Single Family Residential Housing in the U.S. and Canada, Franklin Associates 2009
- A cost curve for greenhouse gas reduction, McKinsey Quarterly Feb. 2007
A study about the costs of reducing greenhouse gas emissions found that improved building insulation provides the highest net income (not cost) over 'business as usual'.[6] Net savings in GWP from adding continuous R-4 EPS insulation in Canada are estimated in Table 2.
Table 2: GWP Reductions provided |
GWP Invested | |||||
|---|---|---|---|---|---|---|
| EPS Production | 683 | 310 | ||||
| EPS Transportation | 24 | 11 | ||||
| Total GWP Invested | 707 | 321 | ||||
| GWP Reductions compared to Base Wall | B.C. | Alberta | Quebec | NW Terr. | Canada Average | |
| Annual GWP Reductions | 513 | 893 | 790 | 1,441 | 742 | 337 |
| Payback Period in Years | 1.38 | 0.79 | 0.89 | 0.49 | 0.95 | 0.95 |
| Savings over 50 Years | 25,639 | 44,640 | 39,505 | 72,050 | 37,124 | 16,839 |
Ingredients & Properties
Both EPS and XPS are closed cell polystyrene foam that's known for addressing moisture issues better than other insulation materials.
XPS is supplied by large corporations in mostly pink, blue and green boards. Many of us remember XPS from fast-food packaging that used extremely ozone-layer depleting CFC gases before they were banned in the 1970s to 1990s. Then some XPS used HCFC gases that also had significant Ozone Depletion Potential (ODP) so they then switched to HFC gases with lower ODP. But their GWP is still hundreds to thousands of times higher than CO2 - negating a large portion of the insulation's intended GWP reductions.
EPS uses pentanes as the blowing agent which get replaced by air, mostly during manufacture and completely a number of weeks or months later depending on product thickness. Aged EPS is about 98% air with no off-gassing and has always been free of formaldehyde and CFC, HCFC & HFC gases.
Table 3: Overview of Ingredients & Properties of EPS and XPS Insulation
| Property | EPS | XPS | |
|---|---|---|---|
| Material: Foam Plastic ≈2% for EPS | closed cell polystyrene | ||
| Material: Insulator | Air ≈98% | mostly HFC or HCFC | |
| Material: Fire Retardant Additive | polymeric | some HBCD, mostly polymeric | |
| Cost / Functional Unit | $ | $$ | |
| Environmental Impacts | |||
| True Long-Term Thermal Resistance 50-year LTTR |
dry | ||
| wet* | to | to | |
| Drying Potential | |||
* per reports referenced below based on limited empirical data for long-term exposure to wet or humid conditions
Effects of Off-Gassing on R-value**
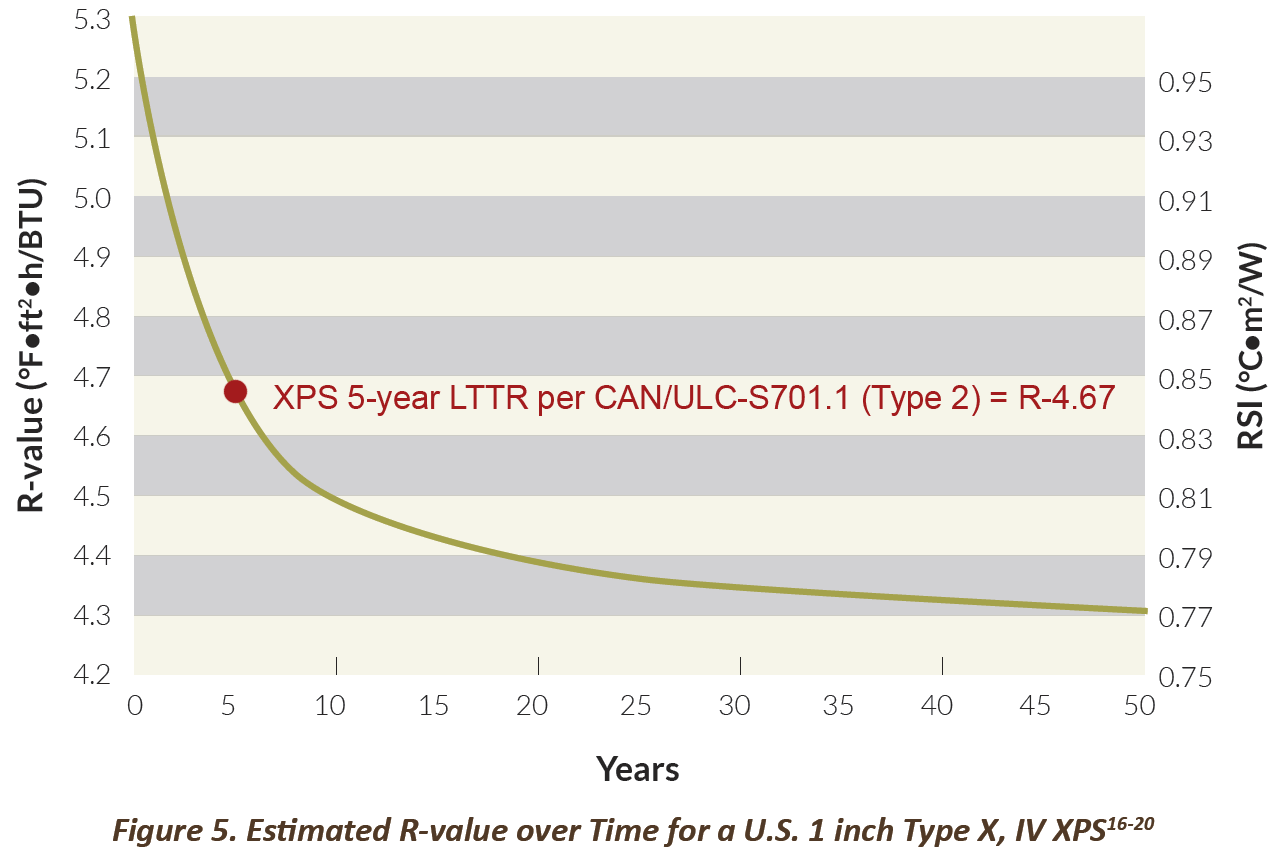
The HCFC or HFC gases in XPS off-gas from the insulation at a slow rate. As refrigerants with lower thermal conductivity than air, they give XPS slightly higher R-values per inch thickness compared to EPS. However, that's only because the applicable laboratory tests are relatively short-term at 180 days of age or using simulated ageing to 5 years. The simulated 5-year values are also often labeled "Long-Term Thermal Resistance" (LTTR) as an approximation of the time-weighted average performance over the first 15 years, which isn't "long-term" for buildings nor necessarily accurate. In reality the R-value of dry XPS in year 10 is already well below the 5-year LTTR and it keeps decreasing from there as estimated in Figure 5 based on studies and tests of XPS off-gassing.[10,12,14,15] Over 60+ year service lives of buildings as the gases escape from XPS, it approaches the R-values per inch thickness of EPS.[15] The warranties of XPS manufacturers confirm this by only covering 80-90% of the advertised R-values.
In contrast, dry EPS does not loose R-value over time which is why the National Institute of Standards & Technology (NIST) chose it as a Standard Reference Material for Thermal Conductivity (SRM 1453).
Estimated R-value of dry XPS over Time[12]

** R means resistance to heat flow. The higher the R-value, the greater the insulating power.
Effects of Moisture on R-value
Water content in any insulation material reduces its thermal performance. Unlike most other insulation materials both EPS and XPS are good at keeping moisture out because of their hydrophobic, non-hygroscopic, and closed cell properties. Besides the gases used, the two materials' manufacturing processes also differ significantly: XPS uses continuous extrusion with dies whereas EPS is made from expanded beads that are fused together in molds.
Liquid Water Absorption
So EPS has bead-boundaries that XPS lacks and they cause a slightly higher absorption of liquid water. The North American industry standards again use short-term tests for water absorption, in effect underreporting the values compared to European standards and results from long-term immersion studies as shown in Table 4.
According to the long-term studies of actual field exposure, the absorption rates for both EPS and XPS start to plateau after one to two months of immersion and the water contents remain almost constant after about a year of immersion.[11] Once the bead-boundaries of EPS are saturated, the closed cells of EPS and XPS resist any additional absorption of liquid water equally well.
Table 4: RCPS Water Absorption by Total Immersion over Time
| Region, Method | Immersion Period | Water Absorption max. % by vol. | |
|---|---|---|---|
| EPS Types 2/II & denser*** | XPS most Types | ||
| USA, ASTM C272 | 1 day | 2-3 | 0.3-1 |
| Canada, |
4 days | 2-4 | 0.7 |
| Europe, EN12087 | 28 days | 3 | 1.5 |
| Worldwide, Long-Term Field Exposure [11] | 2-3 years | 3-7 | 2-5.5 |
*** Since EPS is available at lower densities than XPS, results for EPS Types with min. densities of less than 19kg/m³ [1.2PCF] are omitted
Installation in Wet, Humid Environments
It is well established that XPS and EPS are suitable for many uses in high moisture conditions such as below grade and in inverted (or "protected membrane") roof systems if designed and installed correctly. For use below grade ASCE 32-01 guidelines for insulation of frost-protected shallow foundations (FPSF) and the ASHRAE 90.1 energy standard are commonly used in building codes/design.
ASHRAE 90.1 states "Insulation materials in ground contact shall have a water absorption rate no greater than 0.3% when tested in accordance with ASTM C272" - effectively eliminating EPS as a below grade option despite its proven long-term use worldwide.
ASCE 32, last revised in 2001, provides suggested "effective R-values" for XPS and EPS to account for different water contents as observed in the 1970s to 1990s when mature quality assurance (QA) programs were uncommon.
QA effectiveness only affected EPS because of the different manufacturing processes: some EPS manufacturers didn't adequately assure bead-fusion quality, thereby increasing the sizes of the bead-boundaries and water absorption while XPS' process can't be influenced in such a manner. The absorption results from field observations of some substandard EPS products are still used in ASCE 32-01 by assuming up to 12% water content by vol. for EPS, much higher than the 3% to 7% observed in long-term immersion studies. So ASCE 32-01 reduces the "effective R-value" of EPS incorrectly by up to 35% compared to dry R-value while XPS' is reduced by only 10-20%.
Current ASTM C578 and CAN/ULC-S701 standards for polystyrene insulation require stringent QA programs with periodic third-party inspections so substandard EPS is uncommon now when purchased from certified manufacturers.
Recent Field Observations
ASCE 32-01 assumes water content for XPS below grade to be limited to about 7% by volume.
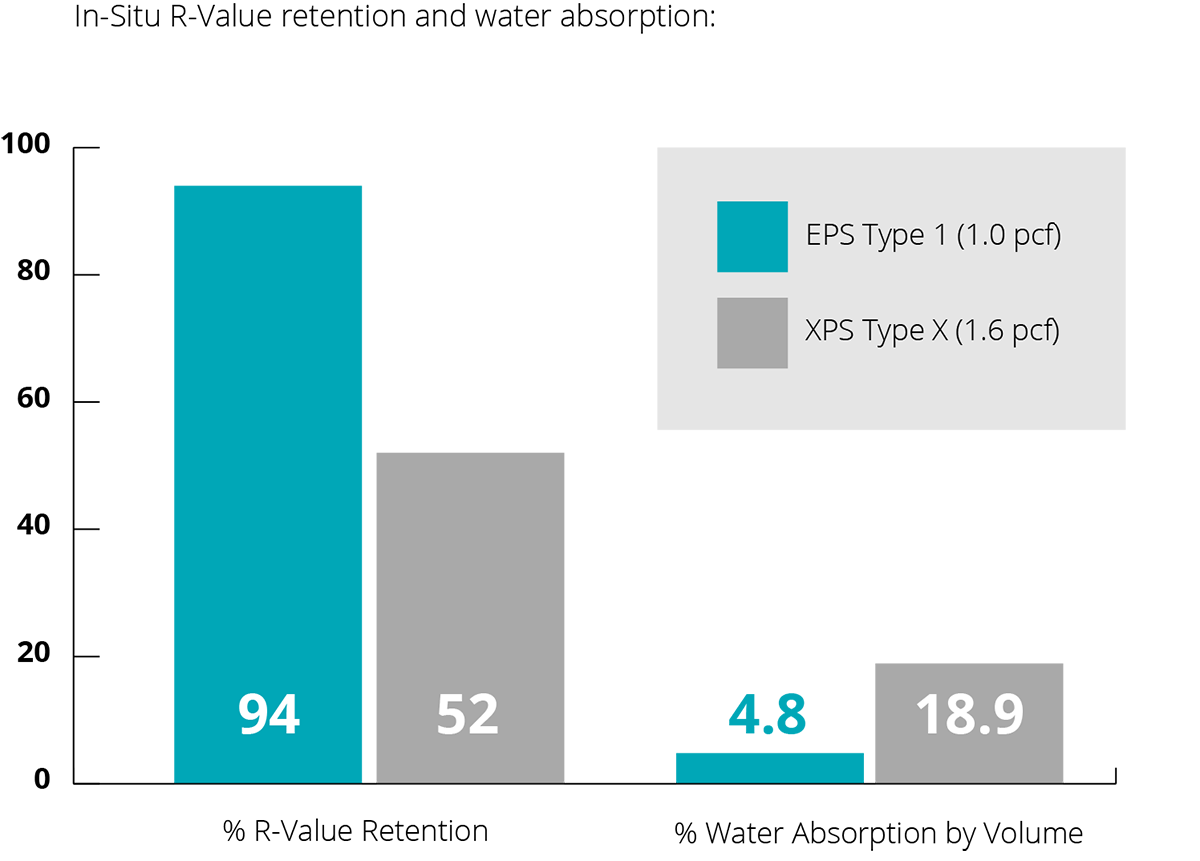
In 2008 an evaluation of side‐by‐side, below grade vertical application [16] with identical protection systems following a continuous 15‐year installation period in St. Paul, MN found that XPS lost 48% of its thermal resistance due to water content of 18.9% by vol. EPS right next to it lost only 6% of its thermal resistance with 4.8% by vol. water content as indicated in Fig. 1.
In 2012 independent 15-year research at the Oak Ridge National Laboratory also reported below grade XPS insulation experiencing up to 44% loss of thermal resistance due to high water contents.[7] In 2013 additional tests of long-term field performance of below grade and roof installations were conducted and the technical bulletin about Polystyrene Foam's Water Absorption & R-values reported:[8]
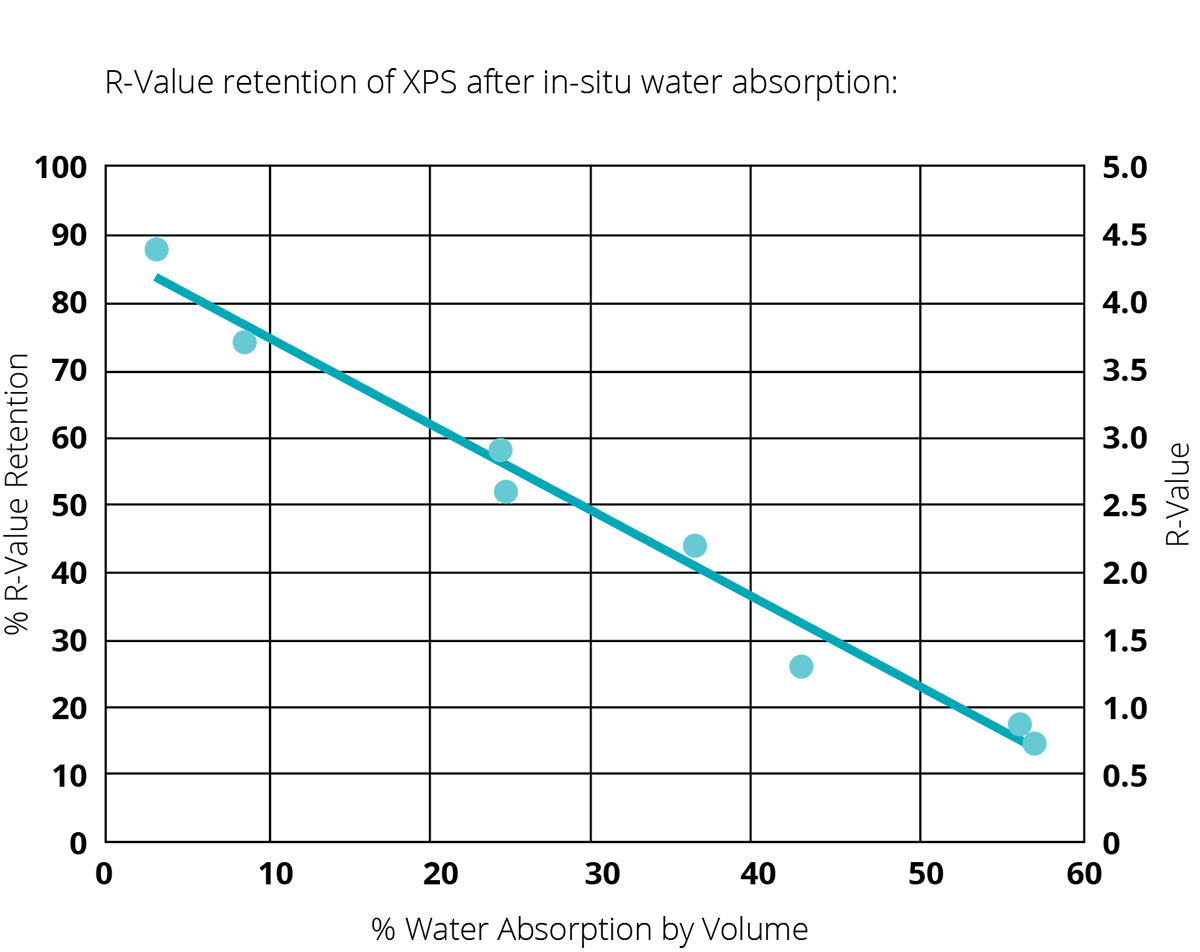
- R-value loss of polystyrene insulation is directly related to the percentage of water content by volume as shown in Fig. 2.
- R-value loss of XPS was more than 80% in some installations with in-situ water contents of up to 56% by volume
XPS' water contents found in three quarters of those installations greatly exceeded the worst-case 7% by vol. assumed in ASCE 32-01.
For polystyrene insulation's water content no correlation can be established between the results of laboratory test methods using total immersion and actual field exposure. Ingress of liquid water can only explain a portion of the in-situ observations and since XPS and well-fused EPS also have zero capillarity/wicking action, the effects of water vapor have to be considered.

Fig. 1. In-Situ R-value Retention and Water Absorption of EPS and XPS

Fig. 2. R-value Retention of XPS after In-Situ Water Absorption
Water Vapor Diffusion & Condensation
In contrast to liquid water, water vapor (humidity in air) can diffuse (penetrate) through the cell walls of polystyrene foam insulation. In construction assemblies EPS and XPS can serve as vapor barriers or as vapor retarders (up to certain thicknesses/densities):
- Impermeable Vapor Barrier (Class I):
< 0.1 perm or < 5.7 ng/(Pa•s•m²) - Semi-impermeable Vapor Retarder (Class II):
0.1-1 perm or 5.7-57 ng/(Pa•s•m²) - Semi-permeable Vapor Retarder (Class III):
1-10 perm or 57-575 ng/(Pa•s•m²)
Note that in Canada the term "vapour barrier" is also used for semi-impermeable vapor retarders (roughly < 1 perm).
EPS' bead-boundaries allow higher vapor permeance of about 1.2 perm versus roughly 0.3 perm for XPS for R-12 insulation boards. Building designers already use that vapor permeance of insulation materials to reduce condensation inside framed, split-insulation walls by specifying a vapor barrier on the other side of the wall.
However, given conducive temperature and vapor gradients, diffusing water vapor can condense inside polystyrene foam's closed cells. What happens thereafter with this liquid water inside cells impermeable to liquid water has not been studied in detail but it becomes apparent that the ability to dry out the insulation would play a significant role.
Drying Potential
The 2008 evaluation of side-by-side EPS and XPS installations measured the water contents upon excavation and again after 4 weeks of laboratory conditioning when the XPS sample still had very high water content while the EPS sample was almost dry again as indicated in Table 5.
The researchers at the Oak Ridge National Laboratory also found XPS drying times of 3 to 6 months.[7] In 2014 additional tests per ASTM C1512 "Standard Test Method for Characterizing the Effect of Exposure to Environmental Cycling on Thermal Performance of Insulation Products" measured low drying potential of XPS compared to the significant drying potential of EPS as shown in Table 6.[9]
EPS' higher vapor permeance results in higher water accummulation during pre-conditioning of the samples but its bead-boundaries also contribute to the better drying potential of EPS compared to XPS.
Table 5: Moisture Contents of EPS and XPS samples after 15 year, side-by-side service below grade
| Moisture contents % by volume | EPS | XPS |
|---|---|---|
| Upon Removal | 4.8 | 18.9 |
| Conditioned 4 weeks @ 72°F, 50%RH | 0.7 | 15.7 |
The more recent research[9,11] suggests a plausible hypothesis for the high water contents of XPS found in moist, colder climate applications: diffusing water vapor can condense inside the closed foam cells when dew points are reached within the insulation; then the low drying capacity of XPS would lock in most of the liquid water and keep accumulating it over time in repeated dew point periods. In contrast, EPS would allow much of it to dry out in periods of improved temperature/humidity levels.
Table 6: Drying Potential of EPS and XPS per ASTM C1512 Environmental Cycling Tests, values in % by volume[9]
| Insulation Type | Moisture Accummulated During |
Moisture Remaining After Environmental Cycling | Moisture Lost During Environmental Cycling | Drying Potential Observed? |
|---|---|---|---|---|
| EPS Type II | 3.2% | 1.7% | 1.5% | Yes |
| 2.1% | 1.6% | 0.5% | Yes | |
| XPS Type X | 0.8% | 0.8% | 0.0% | No |
To assess full seasonal effects in various climates, the ASTM C1512 test's 20-day environmental cycling period isn't sufficient so other test methods or analysis are needed.
Conclusions
15-year research at the Oak Ridge National Laboratory reported below grade XPS insulation experiencing a 10-44% loss of thermal resistance.[7] Water-logged XPS insulation with even higher thermal resistance losses was also found in other installations exposed to high moisture conditions in colder climates.[8]
This means designers cannot rely solely on product data from short-term laboratory test results as established under ASHRAE 90.1 and the dated ASCE 32 (2001) because they don't necessarily address actual site conditions over the intended service life and are based on decades-old research that doesn't account for modern quality assurance during manufacture.
Recent research about additional material properties[9,11,12] suggests that repeated condensation within the insulation combined with the low drying capacity of XPS could explain the high water contents found in some XPS installations. In effect XPS in some applications can leave building owners at higher risk to pay for wasted energy and possibly remediation because XPS won't dry out easily.
For 60+ year building considerations XPS manufacturers overstate R-values and the HCFC or HFC gases they use are strong pollutants while EPS realizes the GWP reductions of insulation with much lower environmental impacts and stable insulation values over time.[3,4,10,11,12] EPS also provides the highest insulation value per dollar spent on foam plastic insulation.
Choose wisely for your Clients & our Environment Build with EPS
Additional References
- Measurement of Exterior Foundation Insulation to Assess Durability in Energy-Saving Performance, Oak Ridge National Laboratory 2012
- XPS Insulation Extracted After Field Exposure Confirms High Water Absorption & Diminished R‐value, EPS Industry Alliance 2014
- Drying Potential of Polystyrene Insulations Under Extreme Environmental Cycling Conditions, EPS Industry Alliance 2014
- XPS & Polyiso Long-Term Thermal Resistance & R-Value Performance, EPS Industry Alliance 2016
- Moisture Behavior of Polystyrene Insulation in Below-Grade Application, S. Cai, B. Zhang, L. Cremaschi, Energy and Buildings 159 (2018), 24-38.
- Polystyrene Foam Insulation in Long-Term Building Applications - Effective R-values, EPS Industry Alliance 2019
- Soprema Comparative Advertising Not Aligned with Canadian Code of Advertising Standards, EPS Industry Alliance 2019
- Use Fully Aged R-values for Insulation & Building Envelope Design, EPS Industry Alliance 2021
- LTTR & Aged R-value, Understanding the Differences, EPS Industry Alliance 2021
- 15-Year In-Situ Research Shows EPS Outperforms XPS in R-Value Retention, EPS Industry Alliance 2008
